The PLSA (Probability of Large Scale Adoption) Predictors
Education Technology Solutions (Australia), Vol 22. (May 2008)
Our technology department here in the Mankato Area Public Schools (Minnesota, USA) likes what we call “wins” – projects that actually result in a large number of staff members using and benefiting from a technology-based resource we’ve helped put in place.
Like all technology departments, we have finite resources, both human and capital. We’ve invested in projects that really take off – and unfortunately a few other projects that have crashed with a resounding, and sometimes expensive, thud! Those “thuds” most memorable include:
- Digital Video Editing (1996) At this time we had a young and ambitious video tech on staff who wanted in the worst way to replace our analog editing equipment with the latest in digital editing software. We spent about $13K for a system that just never did work quite right. The tech became so frustrated (and probably tired of my questions) that she quit and the equipment sat unused. iMovie made an appearance not long after, and the rest is history. What did we learn?
- Don’t buy a technology that is so complicated only a single person can run it. Or cross train if you do.
- Don’t try to fix it if it isn’t broken. Our analog system couldn’t make someone disappear in a shower of sparkles from a scene, but for about everything else it worked fine.
- Interactive Television (1999) At the cost of about $20K (from a grant, not local dollars), we installed an interactive television hook-up in our district staff development room. Other than one university course, an after school advanced math class, and a few meetings, the equipment did not get used and we removed it after two years. We now use other ITV facilities in town for meetings when needed. What did we learn?
- Don’t build it and hope they will come. They won’t come.
- Don’t assume that just because others use a technology, you need it too. Our smaller neighboring districts use ITV for offering classes that the single small district alone can’t provide. They use it to give high school students the chance to take college courses. Mankato doesn’t really have low incident classes because of the size of our high schools and we have several colleges within easy driving distance for kids wanting classes at that level.
- Don’t forget to take entrenched interests into account. Offering Japanese sounds like a wonderful idea until your current world language teachers see it as competition to their own job security.
- Data-mining (2001) We contracted with a regional tech center to develop a data ware-housing, data-mining solution. About six months into the project, the tech center closed. We found another developer. He bailed after deciding his company would rather focus on online testing. Total lose of funds was about $20K and countless staff hours of planning.
- Don’t go it alone. Our project, while important to us, was small potatoes to the developers. We did not get priority service. If there are not many schools asking for changes or fixes, you won’t get much attention.
- Don’t buy a product without thinking of the service and support component. Duh!
- Figure out ways to grow a big system. We started trying to capture every test score, every intervention and every piece of student demographic data. Better to get a subset of things working well than everything badly.
While none of these projects was either financially or educationally catastrophic (I AM still employed), each cost the district and our department many hours of professional and technician time and decreased our credibility.
The rubric below can be used to help objectively determine the Probability of Large Scale Adoption (PLSA) in a school.
Probability of Large Scale Adoption (PLSA) rubric:
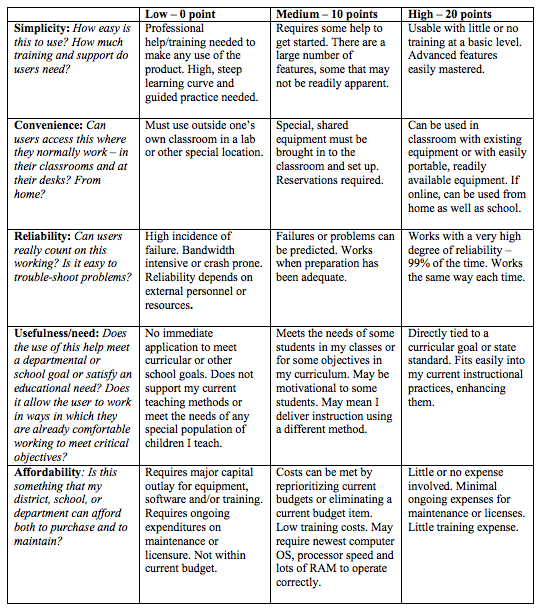
Schools and libraries with different resources and priorities will obtain different ratings. Remember - small schools around our district use interactive television extensively, but we do not, because of our districts’ relative sizes.
Getting a “zero” in either the Usefulness or Affordability categories would seem to negate high scores in the others. Should these be more heavily weighted? And usefulness in itself seems to be a trump card – if the need is great enough, other factors are less important.
This is how I would rank some technology applications in our district, where we are adequately, but not over, funded.
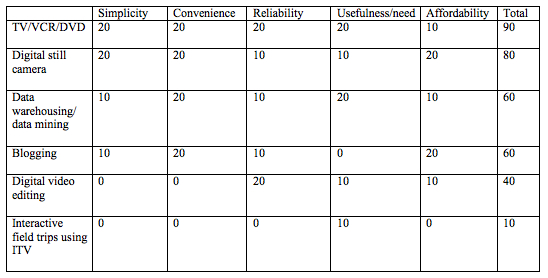
In my estimation, the total point score correlates with the percentage of teachers actually doing these sorts of things in our district.
Right now, what are the chances of large scale adoption in your district of these technologies?
- Internet 2
- MUVEs (Second Life)
- Wiki spaces
- Interactive white boards
- Voice amplification systems
- A new reading/math programs
- Online testing
Use the chart next time someone suggests a new technology project. Even if you don’t use the numbers, the rubric can provide fodder for good discussion.
As leaders and administrators we need to do a better job of predicting what new technology resources and efforts will make it and which will not. A dollar spent on a failure is one less dollar spent on something beneficial to our students. New initiatives need to based on more than good sales pitch.